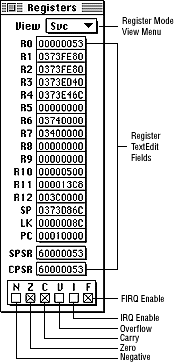

Figure 1: CPU Registers window.
This section first provides an annotated illustration of the window, then discusses the different View options available from the pop-up menu.
Table 1:  Working with the CPU Registers window.
--------------------------------------------------------
To...             |Do this...
--------------------------------------------------------
Change a register |Click on it to select it, then enter
                  |or paste any valid expression.
--------------------------------------------------------
Set or Clear the  |Click the appropriate Status checkbox
current status    |and check it to set the bit, clear it
and/or interrupt  |to clear the bit. You can achieve the
bits (CPSR)       |same result by editing the CPSR field
                  |directly.
--------------------------------------------------------
Set or clear the  |Select and edit the SPSR displayed
saved status and  |value. If the SPSR field is not
interrupt bits    |associated with the correct mode, it
(SPSR)            |is dimmed and displays "not avbl."
                  |You cannot edit the field.
--------------------------------------------------------
Change the program|Select and edit the displayed PC
counter (PC)      |value.
--------------------------------------------------------

Figure 2: Registers window View options.
Use the Registers window View menu to select the operating mode.

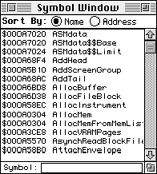
Figure 3: Symbol window.
The following table illustrates how you can work with the Symbol window.
Table 2:  Working with the Symbol window
--------------------------------------------------------
To...          |Do this...
--------------------------------------------------------
Open the window|Press Command-Y or choose Symbols from
               |the View menu to view the Symbol window.
               |
--------------------------------------------------------
Change the     |By default, symbols are sorted by name.
sorting        |To sort them by address, click the
algorithm      |Address radio button. To resort them by
               |name, click the Name radio button.
--------------------------------------------------------
Use auto-search|The Symbol window supports auto-search
               |in the Symbol field at the bottom of the
               |window. Entering the beginning
               |characters of a symbol and pressing
               |Return highlights the first matching
               |symbol. If you're debugging C++ code,
               |the Symbol window shows mangled
               |names.After a search, you can copy a
               |symbol from the editable field at the
               |bottom of the window, even for a partial
               |match.
--------------------------------------------------------